Jeffrey Lewis
Director of the East Asia Nonproliferation Program, The James Martin Center for Nonproliferation Studies
About the image
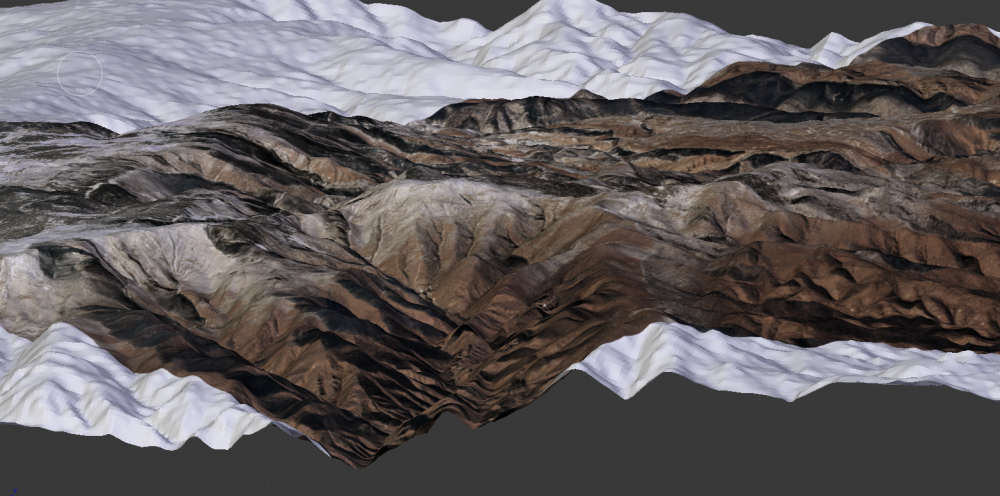
In 2016, North Korea’s nuclear weapons program shifted in an important way, from developing a nuclear capability in the abstract to deploying a nuclear-armed force of ballistic missiles. North Korea conducted an unprecedented number of missile tests and conducted two nuclear explosions. A new 3D model of North Korea’s nuclear test site suggests many more may be on the way.
Over the past year, North Korea conducted 24 missile launches. In some cases, these tests were to develop new missiles like the intermediate-range Musudan ballistic missile. In other cases, the tests were launches by actual missile units. In other words, these were not developmental tests, but military training exercises. The tests provided a hint into North Korea’s evolving nuclear doctrine, as North Korean military units practiced striking ports where U.S. forces might be concentrated in a war and conducted “salvo” launches of several missiles at once as they would likely do in an attack in order to defeat missile defenses.
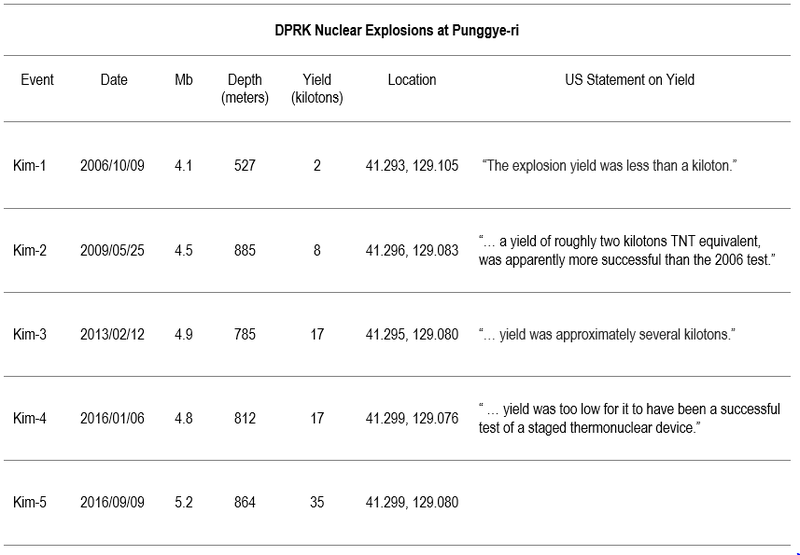
Additionally, North Korea conducted two nuclear weapons tests in 2016 – one in January and another in September. North Korea claimed that the January test was a “hydrogen bomb” and that the September test was a “standardized” nuclear warhead compact enough to arm the missile force that conducted so many launches over the past year. Assessing these claims, however, is difficult based on seismic information alone. As James Clapper, U.S. Director of National Intelligence admitted, when asked about the possibility that the January test might have been a “boosted” device, “We don’t really know. It’s hard to tell what they were going to do.”[1]
It is hard, as Clapper says, but there are ways to try to understand North Korea’s nuclear test program. One way to gain insights is to model North Korea’s nuclear test site at Punggye-ri. We, the authors, created a digital terrain model of it, and then used other open source data to examine the location and yield of North Korea’s nuclear tests. Understanding the layout and purpose of the test site provides some clues to North Korea’s nuclear past – and future. What we found surprised us.
North Korea has conducted five nuclear tests at its nuclear test site since 2006. Since 2009, North Korea has conducted the last four of those nuclear tests in a tunnel complex underneath a single mountain, known as Mount Mantap. The Mantap tunnel complex is just one of four tunnel complexes at the Punggye-ri nuclear test site. Tunnel projects are also visible in mountains to the east of the test site (which is where North Korea’s first nuclear test was conducted), and there are new tunnels to the south and west of the main support area. We modeled the terrain using data provided by NASA and Japan’s METI.[2]
What we really wanted to know was how North Korea’s nuclear tests fit within the mountains that surround the test site. We were especially interested in the last four tests, which all took place in the Mount Mantap tunnel complex, north of the test site. Will North Korea run out of room to keep testing? We used a variety of open source information to locate the explosions and the layout of the tunnel complex.
What amazed us was how perfectly North Korea’s test complex appears to match with openly available descriptions of U.S. nuclear test tunnels. The tunnel layout, based on the bearing of entrance and the location of the explosions, almost perfectly matches the P-tunnel at the Nevada National Security Site, where the U.S. conducted its nuclear testing. We also created a virtual reality model of the tunnels, using images of U.S. tunnels and an animation produced by North Korea’s state-film studio.
It is not surprising that North Korea would bury and space its nuclear explosions like an American nuclear weaponeer. After all, North Korean engineers would be foolish not to take advantage of large amounts of information that the United States has published about containing underground nuclear explosions. Yet the resemblance is still startling.
The model of the test site also tells us something important about North Korea’s ambitions. North Korea could fit many, many more nuclear explosions in branches off the main tunnel into Mount Mantap. Or, North Korea could conduct much larger explosions. In fact, North Korea could conduct nuclear explosions with a yield of a few hundred kilotons at Punggye-ri without blowing through the mountain. And that’s not North Korea’s only test complex. North Korea is digging a similar tunnel complex into Mount Musan, west of the test site. It looks like North Korea has ambitions to conduct many, many more nuclear tests.[3]
While the model does not allow us to completely understand North Korea’s nuclear test program, the test site is sized for a much more ambitious nuclear test program than anyone has been expecting. 2016 was not only a record year for North Korea’s missile tests, but also a record year for nuclear tests. North Korea conducted two nuclear explosions for the first time ever and the last explosion was North Korea’s largest. Staring at the vast vast space beneath the mountains around North Korea’s nuclear test site, there is every reason to think that, absent a diplomatic solution to the problem of North Korea’s nuclear programs, 2017 will be worse.
[1] Christian Science Monitor Breakfast with James Clapper, Director of National Intelligence, St. Regis Hotel, April 25, 2016, www.c-span.org.
[2] The dataset is called the Advanced Spaceborne Thermal Emission and Reflection Radiometer (ASTER) Global Digital Elevation Model Version 2 (GDEM V2). The model has relatively good resolution, although it varies by location and type of terrain. For a discussion of the practical vertical and horizontal resolution of the ASTER GDEM V2 dataset, see: Changwei Jing, Ashton Shortridge, Shengpan Lin & Jiaping Wu (2014) “Comparison and validation of SRTM and ASTER GDEM for a subtropical landscape in Southeastern China,” International Journal of Digital Earth 7:12, 969-992, DOI: 10.1080/17538947.2013.807307
[3] There is an additional tunnel complex to the South of the support area. These mountains, however, do not offer the same overburden as the mountains to the North and West of the support area. This may suggest that the tunnels are not sufficient for North Korea’s nuclear test plans or are simply for storage in case of an attack on the test site.
Sign up for our newsletter to get the latest on nuclear and biological threats.
View interactive visuals, analysis, and data on ballistic missile and SLV launches by North Korea, Iran, India, and Pakistan.
North Korea has altered its missile testing patterns, launching missiles more frequently and from a variety of new locations. What does this mean? (CNS)
When North Korea tested an ICBM on July 4th, it used technologies first seen in the Hwasong-12 test. (CNS)

